

Quick overview — goals of a 60‑day pilot
Question: What is an ai pilot 60-day test plan and what should it achieve?
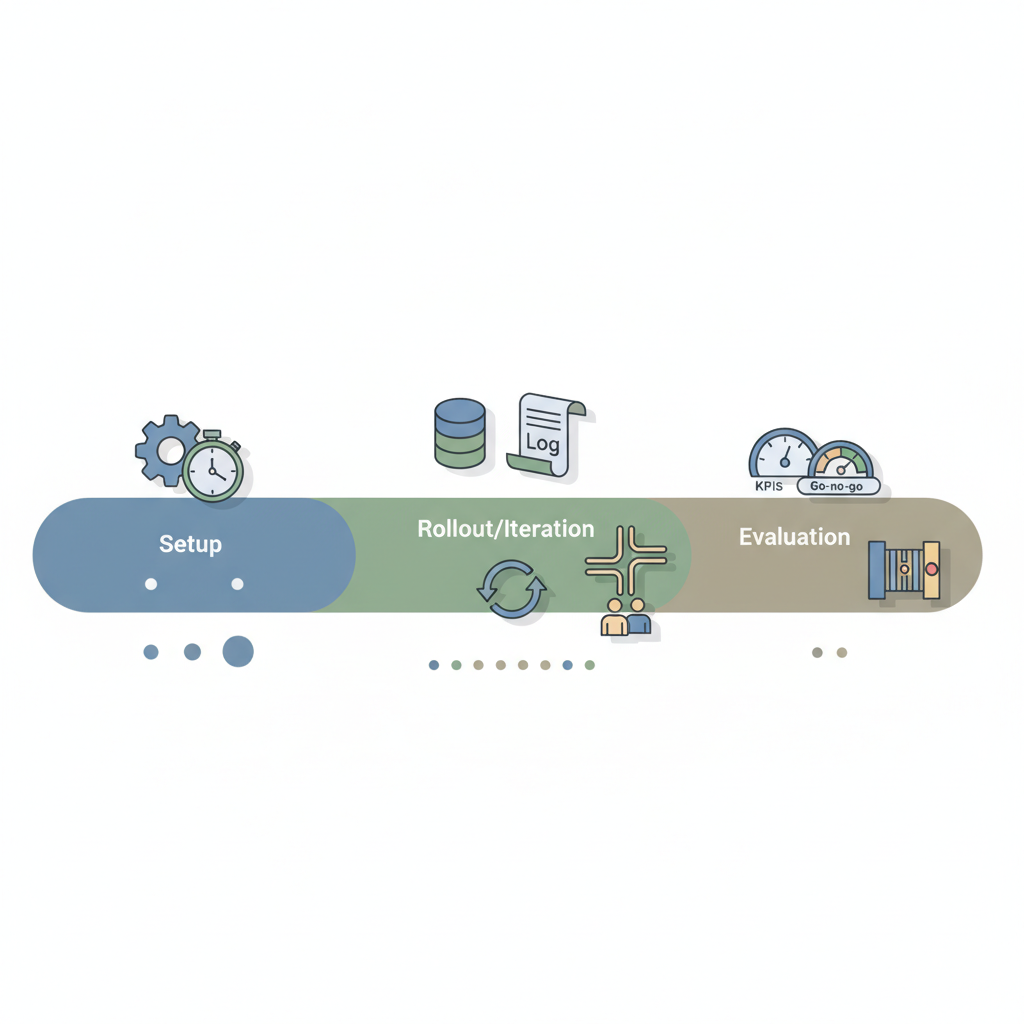
Answer: An AI pilot 60-day test plan is a structured, time-boxed program designed to validate an AI feature or integration on live traffic, measure impact against baseline metrics, and decide whether to productionize. Over these 60 days, you establish baseline performance, collect operational telemetry, run controlled experiments (A/B tests), iterate on models, and pass formal go/no-go decision gates, all of which are essential components of running an AI pilot.
This plan focuses on measurable outcomes for website owners, marketers, and developers. Typical goals are: 1) confirm the AI delivers measurable business improvement (CTR, conversion rate, lead quality), 2) prove operational readiness (latency, error rates, cost per outcome), and 3) surface failure modes so you can build rollback and monitoring. For xproductlist.com, that could mean measuring how an AI-powered product-recommendation widget changes click-through to tool pages and newsletter signups, which aligns with an effective AI implementation strategy.
When NOT to run a 60‑day pilot: skip a 60 day pilot when outputs cannot be validated quantitatively; when the dataset is too small for meaningful tests; when legal or regulatory constraints block live experimentation; or when the cost of errors exceeds the expected benefit.
Phase 0 (Days 0–7): Setup and baseline measurement
Why start with a short setup window? Without clear baselines, you cannot attribute lift to the AI. In days 0–7, configure environments, instrument telemetry, and capture baseline metrics across the same user segments you plan to target. For xproductlist.com, that means recording current page-level CTR to product listings, average session duration on tool pages, and email capture rate.
- Deploy a feature flag so you can turn the AI on/off per user segment.
- Snapshot existing analytics: daily CTR, conversion funnel drop-off, average latency for page resources, and error rates.
- Create an experiment ID scheme to tag AI-driven events for later analysis.
Capture at least two weeks of historical traffic if available; if not possible, document seasonality risks and use conservative thresholds during evaluation. Ensure compliance with local transparency rules (for example, EU requirements for disclosure of automated decision-making) before routing live users to the experiment.
Stakeholder alignment checklist and baseline metrics to capture
Why align stakeholders now? A pilot succeeds when product, engineering, marketing, and legal agree on success criteria and responsibilities. Use this checklist during day 0–7 to avoid late surprises.
- Decision owners: name the business sponsor, data owner, and engineering lead.
- Success metric: primary KPI (for example, relative increase in listing CTR or qualified leads).
- Pass/fail thresholds: specify minimum detectable lift (rule of thumb: small effects need large samples; for visible UX changes you can expect to detect larger effects with hundreds of users per variant).
- Operational SLAs: target P95 latency, error budget, and budget ceiling for API calls.
- Compliance checklist: data retention, consent, and audit logging requirements.
Baseline metrics to capture (examples): daily listing CTR, conversion per visit, average time on funnel pages, server-side P95 latency, API error rate, and cost per API call. Record current values as the launch anchor for the ai pilot 60-day test plan.
Phase 1 (Days 8–21): Controlled rollout and data collection
Phase 1 expands exposure gradually while maintaining control. Start by enabling the AI for a small, representative percentage of users (for example, internal staff plus a small random sample of real users) and collect labeled outcomes. For website owners, this stage is about verifying integration, ensuring logs are meaningful, and watching for immediate regressions in key funnels.
Actionable daily tasks: review logs for the new event types, validate that user-facing outputs look correct across browsers and devices, and check telemetry for unusual spikes in error rates or latency. Keep the feature flagging system in place to rollback instantly if needed.
Measure qualitative feedback alongside quantitative metrics: user session recordings, a short in-product survey, and logs of support tickets. This mixed-methods approach catches issues that raw metrics miss.
Instrumentation, logging, and monitoring setup
Instrumentation is the backbone of reliable evaluation. Ensure events include experiment IDs and model version tags, and forward these to your analytics and observability stacks. Key logs: input payload, model version, model confidence score, response latency, and outcome (e.g., click, conversion).
- Log schema: timestamp, user segment, experiment_id, model_version, input_hash, output_hash, confidence, latency_ms, outcome.
- Set alert thresholds: e.g., CPU/memory spikes, error-rate increase above baseline, or latency degradation over the P95 guardrail.
- Retain audit logs for regulatory review if required.
Quote: "Monitoring an AI system without tracking data drift converts silent model decay into a production outage." Use drift detectors for input distributions and label drift for outcome changes.
Phase 2 (Days 22–42): A/B testing and model iteration cadence
This phase runs A/B experiments at scale and establishes a weekly iteration rhythm. Split traffic between control (baseline experience) and one or more treatment variants that include the AI feature or alternate model versions. Iterate models weekly: train, validate, deploy to a canary cohort, and promote if metrics look good.
Maintain a cadence: deploy model candidate on Monday, collect data through Thursday, analyze Friday, and decide to promote or revert. That gives a rapid feedback loop while limiting risk.
An AI prototype is production-ready only when failures are predictable, recoverable, and cheaper than the value delivered.

Designing A/B tests for AI (units of analysis, sample size, significance)
A/B testing for AI needs clear units of analysis (user, session, page view) and pre-defined significance rules. Common practice: choose the user as the unit when personalization is involved, and session/page view when the AI affects single impressions.
Sample-size rules of thumb: small lifts (<1%) require large samples in the thousands per variant; large UX changes can be detected with smaller groups. Use two-sided tests and pre-register your primary metric. Note that statistical significance does not equal business importance; always check the practical impact.
Quotable: "Design your A/B test so the unit of analysis matches how the AI influences user behavior." Track model version as a dimension to separate model drift from experiment noise.
Phase 3 (Days 43–60): Evaluation, risk review, and go/no‑go gates
In the final phase run full analysis, perform risk assessments, and convene the decision gate. Evaluate primary and secondary metrics over the predefined analysis window, confirm no unacceptable operational incidents occurred, and assess costs against expected ROI.
Conduct a security and privacy review, confirm logging and audit trails, and ensure support teams are trained on the new feature. If legal or regional rules (for example, EU transparency obligations) require disclosures, ensure those are documented and visible to users before rollout.
Decision gate template (business impact, risk, ops readiness)
Use a short decision template to make the final call. Required artifacts: experiment report, incident log, cost projection, and operations runbook. The decision matrix should include:
- Business impact: measured lift, confidence interval, and projected monthly value.
- Risk: open issues, compliance gaps, and potential user harm scenarios.
- Ops readiness: alerting in place, rollback procedures tested, and runbook available.
Decision rule example: promote when primary KPI shows positive lift with acceptable error budget and no unresolved high-severity incidents.
Core KPIs to track (accuracy, precision, latency, cost per outcome, business metrics)
Track both technical and business KPIs. Include accuracy/precision for model correctness, confidence calibration, latency percentiles (P95), cost per API call, and business outcomes like CTR and conversion. A simple KPI table helps keep reporting consistent.
| Metric | How to measure | Example threshold |
|---|---|---|
| CTR lift | Relative change vs baseline (control) | Region-neutral benchmark: positive, statistically significant |
| P95 latency | Telemetry aggregation for API responses | Typical SaaS target: under a few hundred ms |
| Precision / accuracy | Labelled holdout set | Depends on use case; higher for safety-sensitive tasks |
| Cost per outcome | Total AI spend / number of successful conversions | Below business tolerance |
Monitoring without operational thresholds converts subtle degradation into a sudden outage.
Common failure modes and mitigation checklist
Common issues include data drift (input distribution changes), label shift, confidence miscalibration, high latency under load, and unintended bias in outputs. Use this checklist to mitigate:
- Detect drift with statistical monitors and trigger retraining pipelines.
- Limit exposure with feature flags and progressive rollouts.
- Implement fallback UX when confidence is low.
- Enforce cost caps and monitor spend in real time.
- Run bias checks on stratified user groups before promotion.
Reporting template and handoff to production
Prepare a one-page report summarizing experiment setup, primary and secondary outcomes, incidents, cost analysis, and recommended next steps. Include the following table in the handoff to production to make the transition repeatable:
| Artifact | Contents |
|---|---|
| Experiment report | Design, sample size, results, CI, and conclusion |
| Runbook | Rollback steps, alerting contacts, escalation matrix |
| Cost projection | Monthly API call estimates and budget guardrails |
Appendix: Daily checklist and quick templates
Use this daily checklist during the pilot to keep operations focused.
| Day | Daily tasks |
|---|---|
| All days | Check alerts, review error logs, sample outputs for quality |
| Weekly | Aggregate metrics, run drift checks, update model version tags |
| On anomalies | Trigger rollback, notify stakeholders, open incident ticket |
FAQ
What is 60-day ai pilot test plan?
An ai pilot 60-day test plan is a structured evaluation process that validates an AI feature on live traffic over sixty days, collecting baseline metrics, running controlled experiments, iterating models, and using formal decision gates to determine production readiness.
How does 60-day ai pilot test plan work?
The plan works by progressing through setup and baselining, a controlled rollout with instrumentation, A/B testing with iteration, and a final evaluation phase that reviews business impact, operational risk, and readiness to promote to production.