

TL;DR
- Use an ai pricing comparison template to standardize vendor quotes, measure ai total cost of ownership, and compare ai licensing comparison options side-by-side.
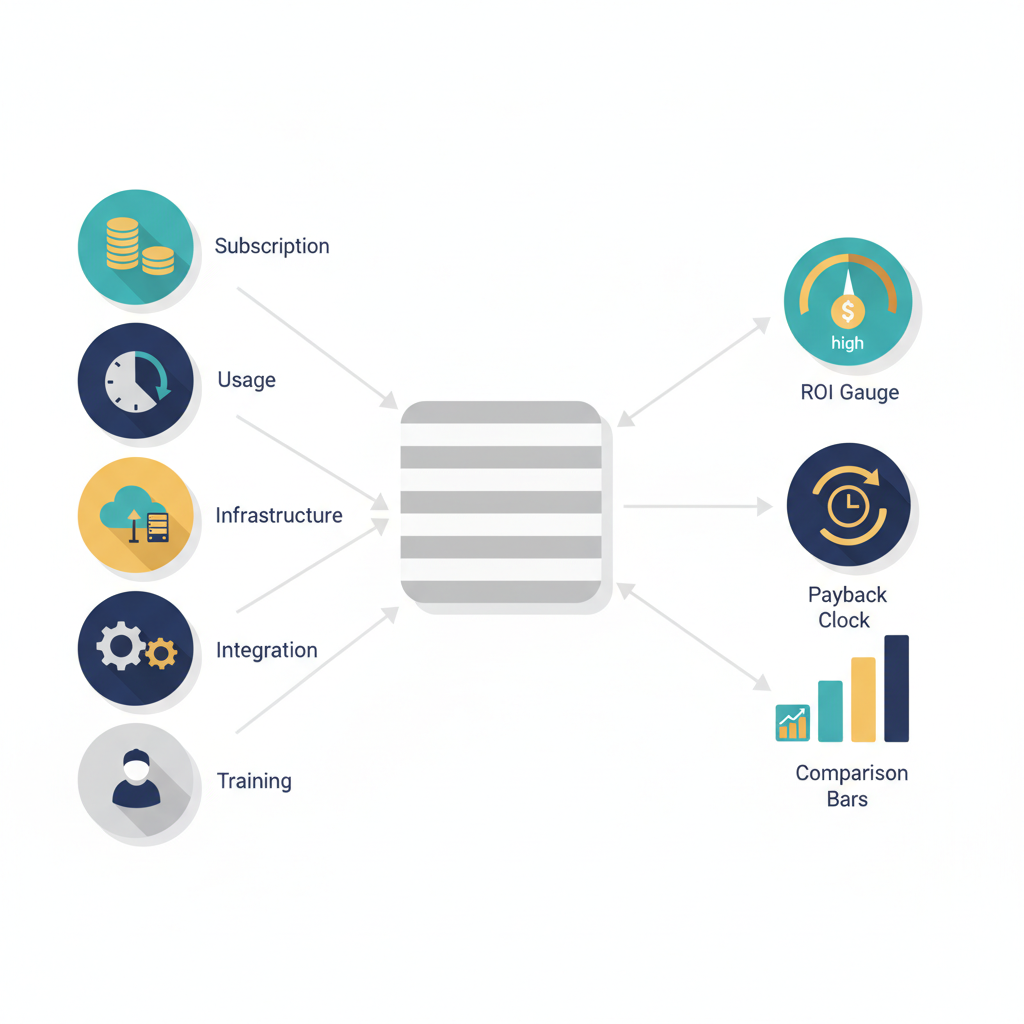
- Include subscription, usage, infrastructure, integration, maintenance, and training costs in your TCO model; use regional cloud calculators and local salary ranges for realistic estimates.
- Use the simple formula: ROI = (Estimated annual benefit − Annualized TCO) / Annualized TCO. Expect 6–18 month payback for mid-market pilots depending on region and scope.

Introduction: Why pricing comparisons break deals or close them
An ai pricing comparison template removes noise from vendor conversations and surfaces the real differences between proposals. When vendors present different metrics—tokens, API calls, monthly seats, or custom enterprise packages—buyers often compare apples to oranges. That uncertainty stalls deals. A template forces the same inputs and assumptions into each quote, so you can objectively evaluate ai total cost of ownership and predict ongoing spend.
This article shows a practical template and workflow for website owners, marketers, and developers who need to compare ai pricing and calculate roi for ai tools. It includes concrete spreadsheet fields, sample formulas, and regional guidance (use AWS, GCP, or Azure cloud pricing calculators and local salary benchmarks when estimating integration costs). For more on this, see Ai tool comparison template.
When NOT to use this template:
- You have no definable KPI or baseline — don’t model ROI until you can measure current performance.
- Your use case requires bespoke on-prem hardware and vendor pricing is non-comparable (request a custom TCO exercise instead).
- The pilot has unknown legal or compliance constraints that could prevent production—pausing cost projections is safer than guessing.
Key cost components to compare (subscription, usage, infra, integration, maintenance, training)
To compare ai pricing effectively, break costs into repeatable categories that map to real invoices and payroll lines. At minimum include:
- Subscription: flat monthly fees or seats charged by the vendor.
- Usage: API calls, tokens, or compute minutes—model high, medium, and low usage scenarios.
- Infrastructure: cloud VM, GPU, egress, and storage costs; use region-specific calculators (AWS, GCP, Azure) for accuracy.
- Integration: developer time to connect APIs, transform data, and build UX; estimate using local salary ranges.
- Maintenance: patching, monitoring, incident response, and model updates—budget an annual percentage of initial integration (common rule: 15–30%).
- Training & change management: user training, documentation, and pilot feedback cycles.
Concrete example: a marketing team may face a $1,200/month subscription, $0.02 per 1,000 tokens, $300/month infrastructure, and 120 developer hours at a local rate—each of these must be entered as separate rows in the template so you can compare vendors that charge per-seat versus per-token.
Licensing models explained (per-seat, usage-based, enterprise, OEM) and how they affect TCO
Different licensing models shift cost risk and predictability. Use an ai licensing comparison framework to understand which model suits your business: For more on this, see Ai product evaluation framework.
- Per-seat: predictable monthly cost tied to users; TCO rises linearly with headcount and can be efficient for small teams with heavy, consistent use.
- Usage-based: pay-as-you-go for API calls or tokens; offers flexibility but can spike without quotas—model a P95 usage threshold to cap surprise bills.
- Enterprise: negotiated annual contracts usually include premium support and volume discounts; plan for minimum commitments and potential overage terms.
- OEM / embedded: vendor pricing designed for resale or bundle—watch for revenue share clauses or distribution fees that increase TCO.
How they affect ai total cost of ownership: per-seat models increase fixed costs; usage models increase variable costs. For an accurate ai licensing comparison, run both a low-usage and a high-usage forecast and compute annualized costs to see which model produces lower TCO under realistic scenarios.
Pick the pricing model that aligns cost risk with operational control: predictable spend for predictable use, variable spend for bursty workloads.
Step-by-step TCO calculator: inputs, assumptions, and forecasting
Build a TCO calculator in a spreadsheet with clear inputs and assumptions. Steps:
- List fixed annual costs (subscriptions, enterprise fees).
- Estimate variable consumption (tokens, API calls) and set low/expected/high usage multipliers.
- Add cloud infrastructure: VM/GPU hours, storage, network egress—use AWS/GCP/Azure calculators for region-specific rates (enter region, machine type, and hours per month).
- Estimate integration and maintenance in person-hours and convert to cost using local salary rates.
- Annualize non-recurring costs (divided over expected lifetime, e.g., 3 years).
Forecasting tip: include a sensitivity table that shows how a ±20% change in usage affects annual TCO. For GEO accuracy, plug in salaries (for example, mid-market US developer cost vs. EU developer cost) and use cloud calculators for each target region.
Example scenarios: small team, scale-up, enterprise
Small team: A 3-person content team uses a per-seat tool at $30/month plus modest API usage. TCO is dominated by subscriptions and small integration (40 hours). A per-seat model often minimizes overhead for this profile.
Scale-up: A growing startup has 10–50 users and bursty API calls. Usage-based contracts with caps and negotiated enterprise discounts fit better; integration costs (200+ hours) and monitoring become material.
Enterprise: The enterprise negotiates annual licensing, advanced support, and on-prem or VPC deployment. TCO centers on infrastructure, compliance, and long-term maintenance—expect higher upfront costs but lower per-unit variable costs. Use these scenarios in your ai pricing comparison template to see which vendor wins under each situation.
Building the comparison template (spreadsheet fields, sample formulas)
Design the spreadsheet with clear columns: Vendor, Pricing model, Subscription (monthly), Variable unit cost, Estimated monthly units, Infra monthly, Integration hours, Integration rate, Maintenance percent, Annualized TCO. Include sample formulas so teams can copy the sheet and plug numbers quickly.
| Field | Sample formula | Notes |
|---|---|---|
| Monthly variable cost | =Unit_cost * Estimated_monthly_units | Tokens, API calls |
| Integration cost (annualized) | =(Integration_hours * Integration_rate) / Lifetime_years | Spread over 2–3 years |
| Annualized TCO | =12*(Subscription + Infra_monthly + Monthly_variable_cost) + Integration_cost_annualized + Maintenance | Bring all to annual view |
Checklist (copy/paste):
- Capture billing unit (token, call, seat)
- Record minimum commitments and overage terms
- Specify support SLAs and included support hours
- Enter region for cloud cost calculations
Always annualize non-recurring integration work to reveal true first-year costs versus steady-state costs.
Estimating ROI and payback period for AI deployments
Use the quotable ROI formula: ROI = (Estimated annual benefit − Annualized TCO) / Annualized TCO. To estimate benefits, quantify time saved, increased conversions, reduced churn, or incremental revenue. Translate benefits to dollars: e.g., a 2% lift in conversion on a $2M ARR site equals $40,000 annual benefit.
Payback period = Initial investment (first-year TCO) / Annual net benefit. Example payback period guidance: a US mid-market pilot with moderate integration might see a 6–12 month payback; a comparable EU buyer could see 9–18 months depending on local labor rates and VAT/GST effects. Use local salary ranges to populate integration cost for credible regional comparisons.
Negotiation tips and red flags in vendor contracts
Negotiation checklist:
- Ask for clear definitions of billing units and example invoices.
- Negotiate caps, alerts, and throttles on usage-based plans to avoid runaway bills.
- Request a conversion path from pilot pricing to production pricing.
- Watch for long auto-renew clauses, data egress fees, and non-refundable minimums.
Red flags: vague support terms, ambiguous SLA credits, bundled hidden fees (training, on-site days), and unclear IP or data ownership language. These items directly affect ai total cost of ownership and the ability to switch vendors later.
Downloadable template + quick-start guide for pilots
Provide a starter spreadsheet with two tabs: (1) input assumptions (usage, salaries, region), (2) vendor comparisons (pre-filled formulas). Quick-start steps:
- Populate usage numbers from logs or reasonable estimates.
- Enter local salary rates for integration work.
- Run low/expected/high scenarios and review the sensitivity table.
- Share results with procurement and legal to align on negotiation points.
For xproductlist.com readers: use the template to compare tools listed on the site by copying vendor prices into the sheet and scoring each vendor on TCO and fit.
Regional considerations: cloud egress, local labor costs, VAT/GST
Region-specific costs change TCO materially. Account for:
- Cloud egress: transfers out of cloud region can add significant monthly costs—use provider calculators for accurate figures.
- Local labor: integration and maintenance rates vary; use local salary ranges rather than global averages.
- Tax and compliance: VAT/GST or local withholding can affect invoice totals and net cost; add tax rows to your template.
Example: a model that is cheap on compute in one region can become costly after egress and support hours are added in another—run your TCO calculator for each region you operate in.
Conclusion and next steps
An ai pricing comparison template forces consistent assumptions, surfaces true ai total cost of ownership, and enables apples-to-apples ai licensing comparison. Start by downloading a two-tab spreadsheet (inputs + comparisons), plug in regional cloud calculator numbers (AWS, GCP, Azure), and run three usage scenarios. Use the ROI formula above to prioritize pilots that pay back within your target window—6–12 months in the US or 9–18 months in the EU for mid-market buyers is a useful benchmark.
Next steps: collect vendor quotes, export usage logs for realistic estimates, and run the template with procurement and legal present to close gaps before signing.
FAQ
What is ai pricing & roi comparison template?
An ai pricing comparison template is a standardized spreadsheet that collects subscription, usage, infrastructure, integration, maintenance, and training costs to compute ai total cost of ownership and compare vendors side-by-side.
How does ai pricing & roi comparison template work?
The template requires you to enter vendor pricing units, estimated monthly usage, infrastructure costs, and one-time integration estimates; it annualizes non-recurring costs and outputs annualized TCO, ROI, and payback period for easy comparison.