

TL;DR
- Quick answer: choose 6–12 focused ai pilot kpis that cover model performance, business impact, adoption, and operations; measure against baselined targets at day 30 and day 60.
- Definition: An AI pilot is a time‑boxed, monitored test of an AI system in production-like conditions to validate technical performance and business impact.
- Quotable: "Measure both model performance AND user/business adoption — both must meet targets to graduate a pilot."
- GEO note: EU pilots often prioritize privacy and explainability metrics; US pilots emphasize ROI and integration speed.

You ran an AI prototype, it seemed promising in dev, and now stakeholders want evidence: how will this move the business? Without clear ai pilot kpis, pilots drift into endless tuning, biased sample sizes, or dashboards nobody trusts. The result: wasted budget and lost credibility. This guide shows how to pick, measure, and report 12 actionable metrics during a 60‑day test so you can make a data-driven go/no‑go decision.
Why KPIs matter for a 60‑day AI pilot
If a pilot lasts 60 days, every metric must answer a decision question: does the prototype solve a user problem reliably enough, cheaply enough, and at scale? ai pilot kpis make that judgment objective. Without them, teams justify progress with anecdotes and tuned examples instead of repeatable results. For more on this, see Ai pilot framework.
Concrete outcomes KPIs force you to prove include:
- Technical validity: the model performs on real inputs, not curated test data.
- Business value: conversions, saved labor hours, or error reductions that translate to dollars or time.
- Operational feasibility: latency, cost-per-request, and data coverage that fit product SLAs.
Example: an ecommerce site running a 60‑day recommendation pilot might require a 5% relative conversion lift and P95 latency under 300ms to consider productionization. That concrete threshold turns vague optimism into a clear decision.
KPI categories — what to measure and why
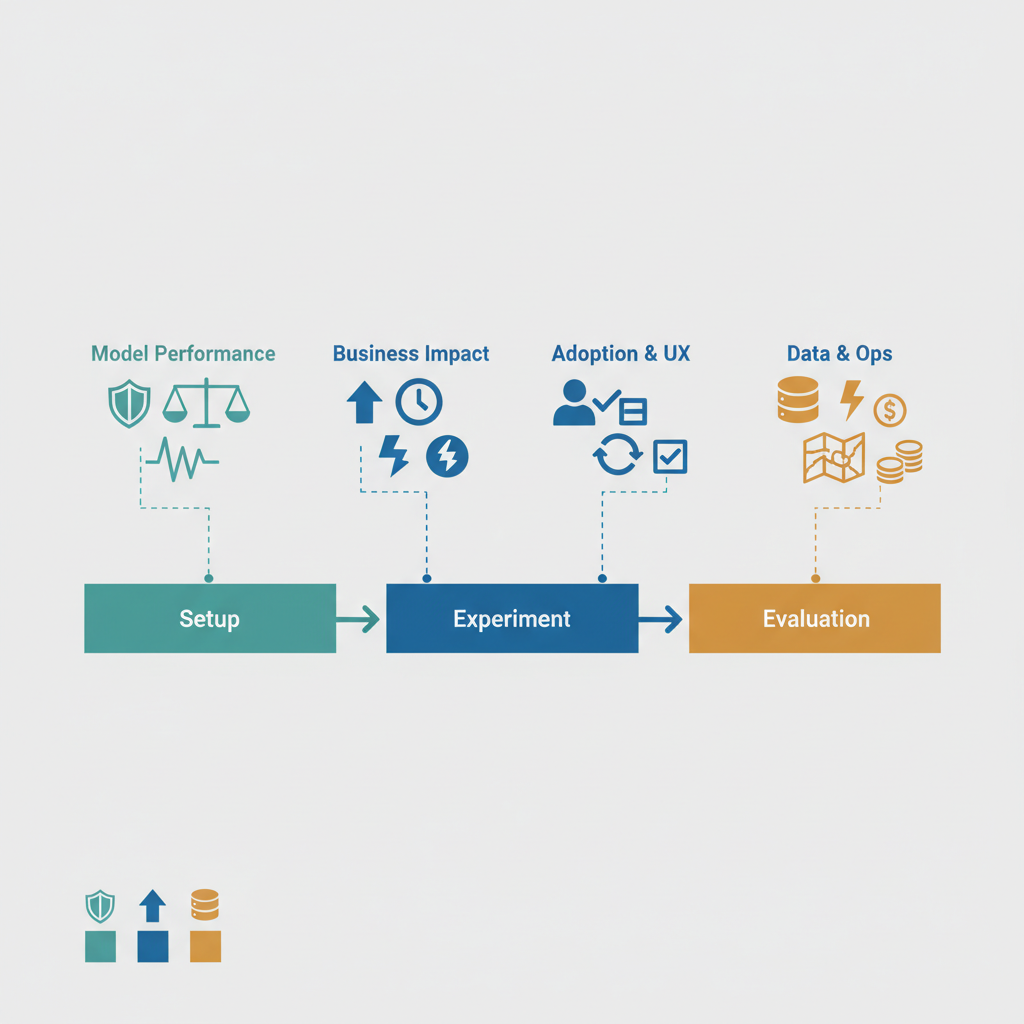
Group ai pilot kpis into four categories so your dashboard is balanced: model performance, business impact, adoption & UX, and data & operational metrics. Each category answers a different stakeholder question: does the model work, does it matter, will users accept it, and can the platform run it?
Use this checklist to ensure coverage across categories: model validity, conversion or efficiency gains, user activation/retention, and operational constraints like latency and cost. Avoid measuring dozens of vanity metrics — 6–12 focused KPIs are easier to interpret over 60 days.
An AI pilot graduates only when technical accuracy, user adoption, and operational cost align with business targets.
Model performance metrics (accuracy, precision, recall, F1)
Model metrics measure correctness on the tasks users care about. Choose metrics that match your problem type: accuracy or F1 for classification, mean absolute error for regression, BLEU/ROUGE or human-rated quality for text generation. Track these on a rolling validation set sourced from production inputs rather than only the training split.
- Example thresholds: target F1 > 0.70 for an intent classifier, or precision > 85% at top‑k for a recommendation filter.
- Monitor per-segment performance: country, device, or user cohort. A model that averages well but fails on a major segment is a deployment risk.
- Use confusion matrices and error examples to prioritize improvements during a pilot.
For regulatory regimes (EU), add explainability checks and fairness metrics as first-class model KPIs.
Business impact metrics (conversion lift, time saved, error reduction)
Business KPIs translate model output into value. Common measures for a 60‑day pilot include percent conversion lift, average time saved per support case, and reduction in manual review errors. These should be measurable with A/B or canary experiments when possible.
- Concrete example: measure a 5% relative conversion lift on a cohort of users exposed to AI recommendations versus control over 30 days, and a secondary metric of average order value change.
- For internal tools, measure full‑time‑employee (FTE) time saved: e.g., pilot reduces content moderation time by 30 minutes per case, multiplied by expected volume to estimate annual savings.
Label business metrics as leading (activation) or lagging (revenue) so stakeholders see short- and medium-term impacts.
Adoption & UX metrics (activation, retention, task completion rate)
If users ignore the feature, great model metrics won’t matter. Track activation (percent of eligible users who try the feature), task completion rate (success on the first try), and short-term retention (users returning to the feature within 7–14 days).
- Example targets: activation > 25% for a non-intrusive assist, task completion rate > 80% for guided flows.
- Collect qualitative feedback alongside telemetry—five annotated user interviews can reveal UX blockers that metrics alone miss.
Data & operational metrics (data quality, coverage, inference latency, cost per request)
Operational KPIs ensure the pilot can scale. Track data quality (missing fields, invalid labels), coverage (percent of requests the model can handle), inference latency (P95 and P99), and cost per request. For typical web apps, conditional targets like P95 latency < 300ms and cost-per-request under a pre-agreed amount help decide feasibility.
- Monitor input drift and label distribution shifts daily.
- Log reasons for failures (timeouts, fallback to rules) to prioritize engineering work.
Monitoring an AI system without tracking data drift converts silent model decay into a production outage.
How to choose 6–12 KPIs for a short pilot (practical prioritization exercise)
Prioritize KPIs by decision impact: pick metrics tied directly to whether you’ll ship. Use this exercise over one workshop (30–60 minutes):
- List candidate metrics across four categories (model, business, adoption, ops).
- For each metric, ask: does this change the go/no‑go decision? If no, deprioritize.
- Limit to 6–12 metrics, ensuring at least one from each category.
- Assign owners, measurement method, and frequency (daily, weekly).
Example final set for a SaaS recommendation pilot: F1 (model), conversion lift (business), activation rate (adoption), retention at 14 days (adoption), P95 latency (ops), cost per 1,000 requests (ops), data coverage (ops).
Setting realistic KPI targets for a 60‑day window (baselining & stretch goals)
Set targets using a two-tier approach: baseline and stretch. Baseline is conservative (what you need to keep the product stable); stretch is aspirational (what justifies a full roll-out). Baselining uses historical data or a short pre-pilot measurement window.
- Baselining: run a 7–14 day pre‑pilot measurement for business metrics or use existing analytics to set expected ranges.
- Stretch goals: set a ~10–30% improvement over baseline for conversion or time‑saved metrics, depending on feasibility.
Document measurement windows and statistical significance rules up front (e.g., 80% power, 5% alpha) so day‑60 claims are defensible.
Data collection, tooling and dashboards (examples + lightweight templates)
Collect ground truth alongside live data. Instrument both inputs and outputs: request payloads, model scores, feature flags, user actions, and manual labels. Use a lightweight stack: logging (application logs + structured events), a metrics store (Prometheus or cloud metrics), and a BI dashboard (Looker, Data Studio).
Checklist to copy:
- Event schema: timestamp, user_id (anonymized), input_type, model_version, output_score, action_taken.
- Label capture: mechanism for human review and storing labels linked to requests.
- Alerts: threshold-based alerts for P95 latency spikes and data drift.
Template: build a dashboard with tabs for model health, business impact, adoption funnels, and operational costs. Update owners weekly.
Go/no‑go decision rules tied to KPIs (example decision matrix)
Tie KPI outcomes to explicit actions. Use a simple decision matrix that maps metric achievement to go/no‑go and remediation steps.
| Metric | Baseline | Stretch | Decision if met |
|---|---|---|---|
| Conversion lift | >2% (stat. signif.) | >5% | Baseline: extend pilot; Stretch: roll out |
| P95 latency | <300ms | <200ms | Fail: optimize infra before roll-out |
| Activation rate | >20% | >30% | Fail: iterate UX |
Example KPI report: what to present to stakeholders at day 30 and day 60
Day 30 should surface trends and early blockers; day 60 should present definitive results against targets. Each report must include:
- Executive summary: top-line go/no‑go recommendation.
- Dashboard snapshots: model metrics, business impact, adoption, and ops costs.
- Action items and risks: technical debt, data gaps, regulatory concerns.
Include raw numbers, confidence intervals, and a short list of labeled failure cases illustrating common errors.
Quick case study (hypothetical SaaS or creator workflow) showing KPI setup and outcome
Hypothetical example: a SaaS content tool adds an AI title suggestion feature. Team selects 8 KPIs: suggestion precision (model), adoption rate (activation), suggestion-to-publish conversion (business), time-to-publish saved (business), retention at 7 days (adoption), P95 latency (ops), cost per 1k suggestions (ops), and data coverage (ops).
At day 30, precision hit baseline but adoption lagged; UX changes improved activation by day 45. At day 60, conversion lift reached 6% (stretch) and P95 latency remained under 250ms, leading to a green light for phased rollout.
When not to run an AI pilot
Run a pilot only when you can evaluate outputs and collect labels. Don’t run a pilot if any of the following apply:
- There is no way to measure ground truth or label outputs reliably.
- Data privacy/regulatory constraints prevent required telemetry collection in your target region.
- The expected request volume is negligible and won’t produce statistically meaningful results within 60 days.
- Operational costs exceed projected value with no path to optimization.
Conclusion — next steps after the pilot based on KPI outcomes
After day 60, use KPI outcomes to pick one of three paths: ship with monitoring and rollout plan, iterate with a prioritized backlog, or pause and re-evaluate assumptions. Capture decisions, owners, and timelines in a short post‑mortem. Remember the quotable rule: "Measure both model performance AND user/business adoption — both must meet targets to graduate a pilot."
FAQ
What is defining kpis for an ai pilot?
Defining KPIs for an ai pilot is the process of selecting measurable technical, business, adoption, and operational metrics that determine whether a time‑boxed AI test delivers sufficient value and reliability to move toward production.
How does defining kpis for an ai pilot work?
Defining KPIs works by mapping stakeholders' success criteria to measurable indicators, baselining current performance, setting baseline and stretch targets, instrumenting telemetry, and agreeing on decision rules for day 30 and day 60 reviews.
References
- 2024 NIST GenAI Pilot Study: Text-to-Text Evaluation Overview and Results
- Model monitoring in production — Azure Machine Learning documentation
- Introduction to Vertex AI Model Monitoring — Google Cloud
- The gen AI operating model: A leader's guide — McKinsey
- AI ROI: The paradox of rising investment and elusive returns — Deloitte